Interpretability Track
Use Perception Test as a benchmark for VLM interpretability and win prizes!
Deadline for submissions: December 1st, 2025
Overview
The goal of the Interpretability track is to encourage the development of techniques that provide insights into how state-of-the-art perception models make their decisions. Methods can be varied in nature, i.e. behavioral/black-box, mechanistic, or simply visualizations that explain why a model succeeds or fails at one or more Perception Test tasks.
Contact: viorica at google dot com
How to participate
You can use any method you prefer, as long as it highlights convincingly how a model solves (or fails at solving) one or more tasks in the Perception Test.
You will be asked to submit a colab notebook demonstrating your explanations or predictions on example videos from the Perception Test benchmark, as well as a short tech report (max 2 pages) decribing the analysed models, how they were initially trained, and the methods used for interpretability and analysis.
Bonus points for works that leverage the different types of annotations in the Perception Test to design quantitative explainability methods, e.g. show correlations between saliency / attention maps produced when answering videoQAs and ground truth object tracks.
Perception Test tasks
In Perception Test, there are 132 unique questions in the multiple-choice videoQA dataset. Each question is applied to multiple videos (from 20 videos up to more than 1000 videos). We define as Perception Test task a videoQA and the videos it is applied to across train / valid / test splits of the benchmark.
A meaningful interpretability method should identify a pattern or explanation that applies to all or most of the videos within one or more tasks.Example of a Perception Test task
Question: "The person uses multiple similar objects to play an occlusion game. How many such objects does the person use?"
Options: a) 4 b) 2 c) 3
For this task, there are 116 (out of 2184) train, 305 (out of 5900) valid, and 189 (out of 3525) test videos; see example below. These videos also have ground truth annotations for object tracks, action segments, and sound segments that can be used to quantitatively prove that the model is paying attention to the relevant spatio-temporal regions in the frames.
Getting Started with Perception Test
To get started with Perception Test, our github page has all of the relevant information. Below is a list of pointers to useful information:
| Getting Started | Perception Test Github Page | Demo: data_visualisation.ipynb | Interp Demo: PerceptionLM_Demo.ipynb |
| Sample Split | sample_videos.zip (215MB) | sample_audios.zip (84MB) | sample_annotations.zip (3MB) |
| Train Split | train_videos.zip (26.5GB) | train_audios.zip (12.3GB) | train_annotations.zip (30.6MB) |
| Valid Split | valid_videos.zip (70.2GB) | valid_audios.zip (33.1MB) | valid_annotations.zip (81.5MB) |
| Test Split | test_videos.zip (41.8GB) | test_audios.zip (19.3GB) | test_annotations.zip (633.9kB) |
| Cut Frames | cut_frame_mapping_train.json | cut_frame_mapping_valid.json | For videos where the end gives away the answer (cup-games, stability, etc.) |
| Annotation Details | Descriptions on Github. |
Resources and Examples
We provide a starter kit with examples for generating visualizations on videos from the Perception Test, as well as some reference works that study LLMs or image VLMs, which might be applicable to video VLMs.
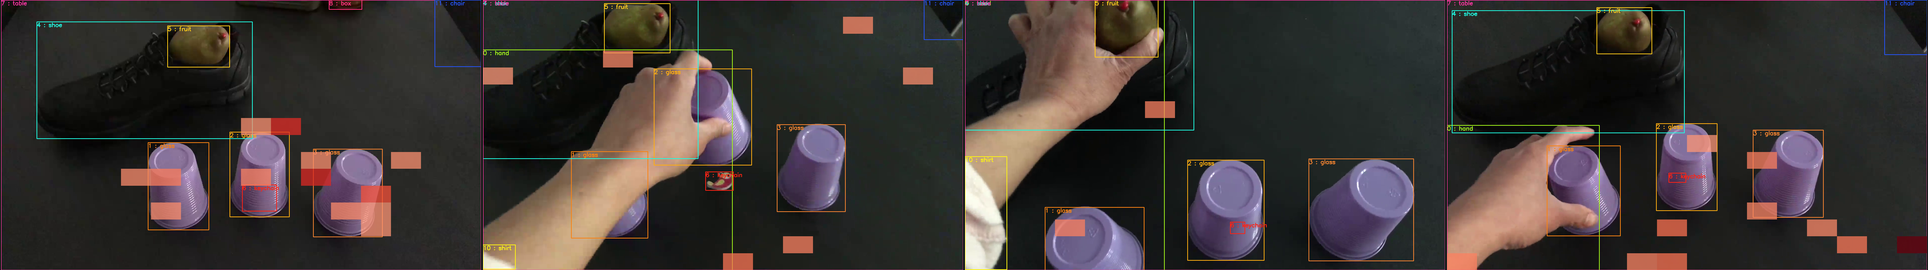
Featured at the top of this page is an example of a visualization using the ground truth object tracks overlaid with the visual attention from PerceptionLM using 4 frames as input. At intermediate layers, we can see where the model pays particular attention to (some of the cups, but also other areas!):
The figure above shows the maximum activations over all the layers overlaid on the video frames.
You can find this visualization in the PerceptionLM demo notebook linked below, which uses TransformerLens. Suggested resources and ideas to explore (please ignore if not useful for your approach):- PerceptionLM tutorial in PyTorch using Transformer Lens for visualizing attention maps overlaid on object bounding box tracks.
-
Predict the accuracy of the model without labels, perhaps from some other signals in the model, e.g. confidence. This paper tries to do so for LLMs by training a meta-model on top of confidence scores.
-
Use logit lens to analyze object hallucinations. E.g. These papers ([1], [2]) analyse image VLMs, attributing hallucinations to low confidence logit readouts and poor visual attention activity in early layers.
-
Analyse the geometric distribution of attention as an indicator for how well models can do spatial reasoning; e.g. this paper ([3]) for image VLMs.
Judging Criteria and Timeline
Submissions will be evaluated single-blindedly by the organising team, considering the below criteria:
- Generality: How convincingly does the method explain the model behaviour across all videos in one or more Perception Test tasks? Does the method provide qualitative or quantitative results?
- Novelty: Does the proposed method bring new insights into understanding the strengths and failures of video VLMs?
- Clarity and reproducibility: Are the methods and results clearly described in the tech report and can they be easily reproduced when running the colab?
The timeline for this track follows the main challenge:
- September 1st: Interpretability track open for submissions
- December 1st: Deadline for colab and tech report submissions (11:59pm AOE)
- December 8th: Decision to participants
Upload your final colab notebook file and tech report to this Google Form.